Draw Graphs of Equations in Windows 10 OneNote
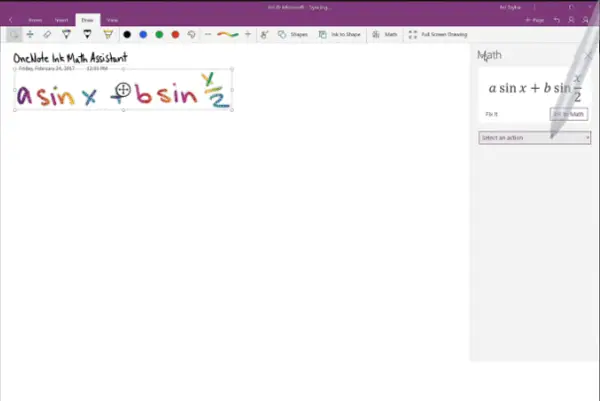
Now, when you want to solve a math equation and write it down, the Ink math assistant will jump into action and quickly plot an interactive graph to help you visualize those hard-to-understand math concepts. Besides, it integrates well with Editor, the recently announced intelligent writing assistant in Word. The dual combination of these apps makes Office an even better tool to help you learn things in a more interactive way. You can perform multiple actions like, zoom in and move the graph to observe intersection points or change values of parameters in your equations to better understand how each of them reflects on the graph. When all appears well, you can save a screenshot of the graph directly to your page to revisit it later. So, let us see the way to draw graphs of an equation in Windows 10. To do this, begin by writing your equation. For example: y=x+3 or y=sin(x)+cos(2x). Next, use Lasso tool to select the equation and then, on the Draw tab, click the Math button.
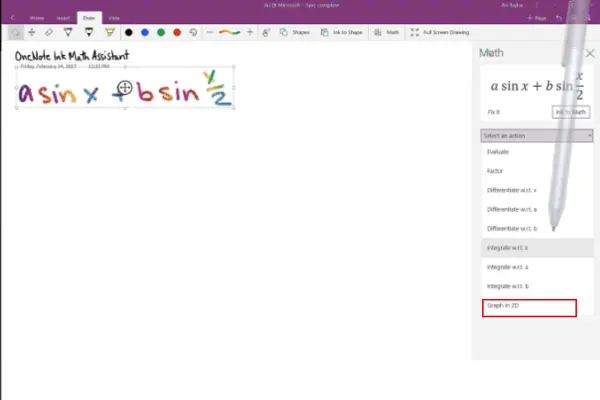
Now, from the drop-down menu that displays a list of options in math pane, select the option – Graph in 2D.
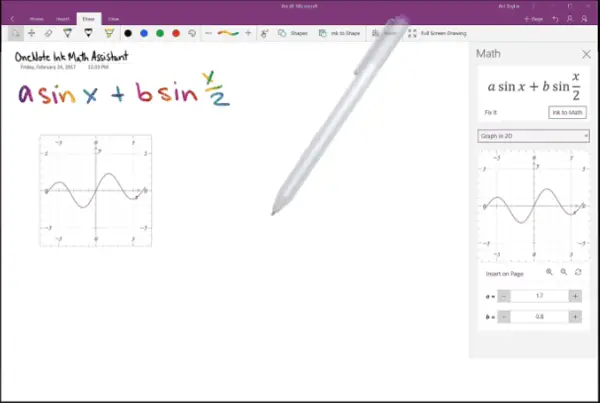
You can change the appearance of the graph of your equation—use a single finger to move the graph position or two fingers to change the zoom level. Then, use + and – buttons to change the values of the parameters in your equation. When done, click the Insert on Page button to add a screenshot of the graph to your page.
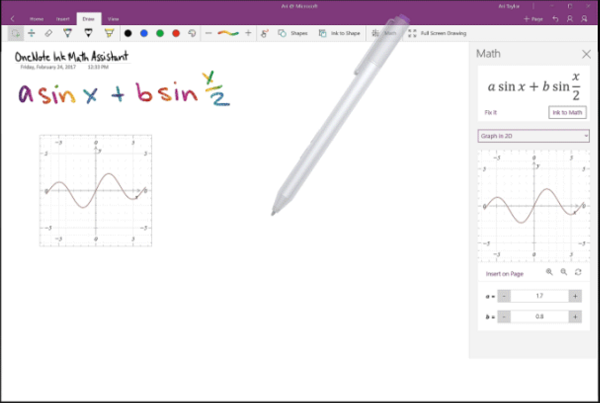
That’s it! This is how you can draw graphs for equations in OneNote Windows 10 app. Please note that Ink Math Assistant is available in OneNote for Windows 10, for Office 365 subscribers only.